350 words (3 minutes reading time) by Colin Weatherby
Professor Joseph Drew has produced his annual analysis of local government expenditure in NSW. He has also looked at the reasons for the latest large rate increases being sought by councils. Professor Drew gives his usual clear and calm description of the findings.
I think his videos have become an elegy for local government.
I can’t believe that the council CEOs across rate capped states are not raising the alarm. It is almost as if they are coated with data Teflon – the facts are not cutting through. Perhaps Tim Whistler is closer to understanding the problem and council’s simply don’t know what to do. Or, they are paralysed by the fear of making difficult and unpopular decisions. Or, they don’t want to upset the state governments.
Large rate increases
Professor Drew attributes the large rate cap increases in NSW to three factors:
- Constrained revenue because rates have been capped, intergovernmental grants are indexed to CPI and grant funding is reducing, regulated fees and charges, and mandated discounts.
- Cost pressures from increases in depreciation, contracts, energy-intensive materials and services, and insurances.
- Delays in addressing the growing gap between revenue and costs, which means that instead of ratepayers getting small increases each year there are now big corrections occurring.
I don’t think there would be a senior officer in local government in the rate capped states who would disagree with Professor Drew. Watch his video for his enlightening explanation of what has happened to grants, the problem with regulated fees, and the moral foundation for rate discounts and whether they are achieving the intended outcome.
Revenue and expenditure 2018 to 2024
When Professor Drew looks at revenue and expenses across local government in NSW (he gives data for the whole state and then breaks it down by rural and urban councils), the extent of the problem is immediately apparent. He says the data will be the same in Victoria.
I will let Professor Drew’s graphs speak for him.
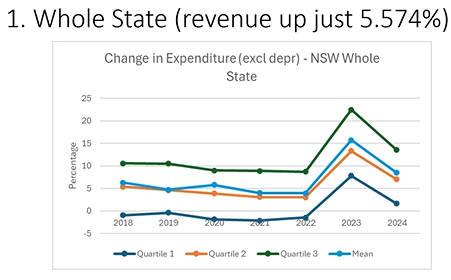
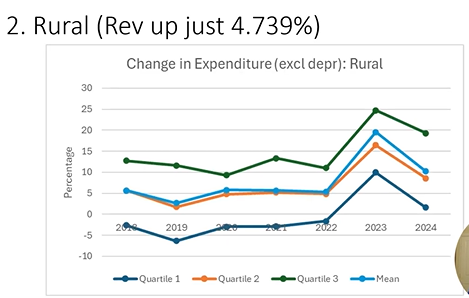
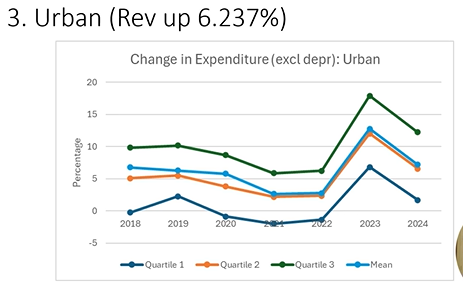
Please watch the video to benefit from Professor Drew’s explanation of the importance in understanding the variance between quartiles, Unsurprisingly, councils are not uniform in their results across the state. Some are doing better than others.
Thank you Professor Drew for providing empirical data and trying to shed light on a problem that should not need extra light for it to be seen. Perhaps, people just need to open their eyes?
