1500 words (14 minutes reading time) By Lancing Farrell

I was reading an article about la cucina povera, the cuisine created in Italy over centuries based on the food prepared by poor and sometimes starving people. Throughout history, people have experienced food insecurity and famine and they have adapted, but none have done it as well as the Italians. In Italy, love, ingenuity and scarcity combined to give birth to a new and delicious cuisine that has become mainstream.
I wondered, can a similar thing happen to local government as it is starved of funds and impoverished by the Victorian government’s rate cap?
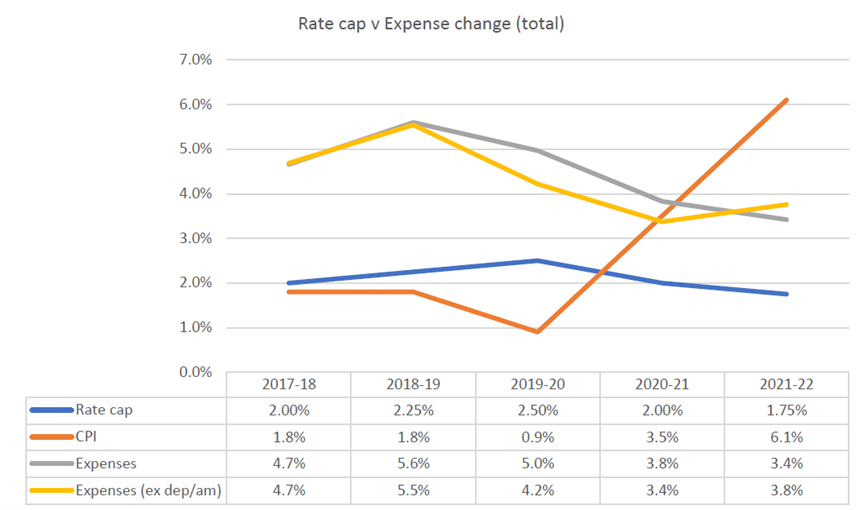
As a reminder, the rate cap is the annual increase in municipal rates (a property tax) that the Minister for Local Government approves. A rate cap is recommended to the Minister by the Essential Services Commission based on Consumer Price Index (CPI) and sector salary increases. It has been in place since 2016 and the graph below shows the gap between rate cap increases, CPI and actual cost increases between 2017 and 2021.
In response to the ongoing impact of the rate cap on council finances, the Municipal Association of Victoria (MAV) and Local Government Finance Professionals (FinPro) have partnered to develop a dataset which can be used to demonstrate and monitor the financial sustainability of Victorian councils.
In November they released a report using the dataset that identified four serious risks to local government financial sustainability that require immediate action:
- Deteriorating underlying surplus across local government
- A significant asset renewal gap
- The compounding effect of a rate cap which has consistently been set below the cost increases experienced by councils
- A limited and reducing unrestricted cash position of many councils
The dataset is drawn from the annual reports of all Victorian councils and the forward projections in council budgets and financial plans. It is hard and irrefutable data.
The report breaks down the data into small rural, large rural, regional cities, metropolitan and ‘interface’ councils (i.e. peri-urban councils growing rapidly in response to Melbourne’s population growth). You could argue that this is too few categories to properly represent the range of councils in Victoria. Really, all 79 are different – they have different assets and asset condition; different size communities with different needs; and different local economies. These are important differences that make a single rate cap for the whole state problematic.
The report shows that the councils in the most financial difficulty are small rural and interface councils. Regional cities and metropolitan councils are faring best at this stage. All have a rapidly deteriorating financial position when underlying deficits, working capital and expenditure are examined longitudinally.
Cumulatively, over the first four years of rate capping the gap between the cost base increase and the rate cap was 4.0% for the sector, and for interface councils and small rural councils of 11.1% and 9.0% respectively.
Source: The Sustainability Gap – November 2022 (Municipal Association of Victoria and Local Government Finance Professionals).
It is noteworthy that some sector experts are predicting a ‘one-off’ increase in the gap of another 4% in 2022/23 as the combined impacts of a rate cap of 1.75% and CPI greater than 6% take effect. This will rapidly increase the impact of the cap on financial sustainability.

As someone who has spent over 30 years working in infrastructure management in local government, the report is not surprising. Councils bear a disproportionate amount of the responsibility for providing essential community infrastructure in comparison with their share of taxation revenue, and the rate cap has squeezed their primary source of revenue.
The graph above shows the heavy reliance on rates (i.e. a property tax) and limited other ‘own source’ revenue. In Victoria, councils have no direct access to national or state taxation revenue and grants are the re-distributive mechanism of choice for other levels of government. Both grants and contributions (typically assets, or funding for assets, built and ‘contributed’ by developers during urban development) exacerbate the problems facing local government because they increase capital assets without a corresponding increase in operating revenue. More on this later.

This graph above highlights the key issue. The dollar values show comparative revenue levels and asset value. Councils own about 38% of the value of assets held by the Victorian government and have 18% of the revenue to care for them. The ‘revenue to asset ratio’ of each level of government is further illustrative of the problem. The Commonwealth ratio is 150%, the State is 500%, and local government is 1000%. This is not the whole story, as about 15% of local government revenue is contributed assets, so the ratio is closer to 1200%. Councils have inadequate revenue to properly care for so many assets.
This is compounded by the grants provided to councils by the Victorian government, which are typically to create new assets. This is more significant factor in the deteriorating financial position of interface councils, who have special access to State grants for the infrastructure necessitated by the State planning processes accelerating urban growth at the edge of Melbourne. These councils also receive large amounts of assets from developers who are required to build them as part of land subdivision and then ‘contribute’ them to the local council.

The cumulative effect of adding capital assets that need to be staffed, cleaned, repaired and replaced, to the balance sheet without a corresponding increase in operating funding, is underlying deficits. The graph above shows the current performance of local government.
The asset value on balance sheets of interface councils have grown at the same or greater rate than population growth and revenue has grown at about half that rate. For the small rural councils, the problem has always existed. When rate capping commenced, they had assets in comparatively poor condition because their large amounts of assets have small populations to pay for them. The rate cap has squeezed them even harder and problems that were emerging have grown much faster.

The problem of an ever-growing asset base has been apparent across the sector for a decade if you look at whether or not councils have spent the equivalent amount to depreciation in renewing assets. The graph above shows recent council spending in Victoria. It lags depreciation and has done for many years at some councils. This is creating an asset renewal gap and increasing demand for operating resources to repair ageing assets.
Based on actual financial performance from 2016-17 to 2020-21, its evident that Councils have remained viable by reducing investment in asset renewal expenditure relative to depreciation. Councils are not funding their asset renewal needs which will result in higher maintenance costs, lower asset service standards and the potential for asset failure. As funds are redirected to address the imbalance between the local government cost base increases and the rate cap, the asset renewal gap will only continue to grow (2016-21: asset renewal gap of $1.9 billion).
Source: State of Victorian Local Government Finances, October 2022 (Municipal Association of Victoria and Local Government Finance Professionals).
Assuming that depreciation represents that rate of consumption of assets (this is not exactly the case but it is close), each year the council should spend that amount renewing assets. Failure to spend that amount over a long period of time will result in asset deterioration. Most councils have been spending less than 100% of depreciation for decades and many have aimed for the State government benchmark of 50% of depreciation. Everyone who understands assets will know that this benchmark is not sustainable over a long-period. The calculation of depreciation might not reflect the actual consumption of the asset in the short-term, but it captures it over the total asset life. You can’t spend half your depreciation forever.

The graph above shows that councils are not always helping themselves in the decisions they make about their capital. You could argue that not enough of the capital available is being used to renew/upgrade assets and too much is being used to create new assets. In part this is fueled by capital-only grants from the State government. It is also a natural response from politicians to a growing population and changing community preferences. People vote and they stand at the counter and tell you what they want. In comparison, roads wait for the bureaucracy to speak for them. People want services and better infrastructure. It all costs more.
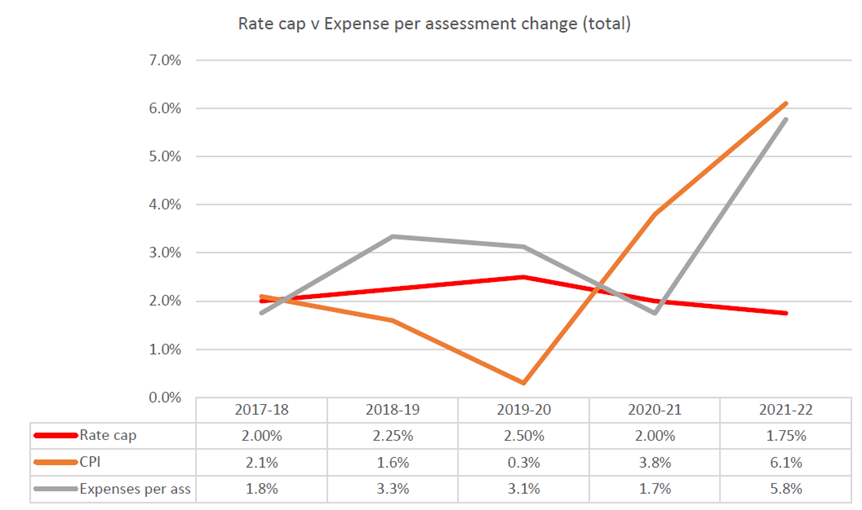
Finally, the analysis of expenditure per assessment (i.e. rateable property) clearly shows that councils are locked in to an unsustainable level of expenditure if the rate cap continues. The graph above compares council expenditure to the consumer price index (CPI) and the rate cap. The pandemic depressed council expenditure but it is now increasing rapidly in response to the inflationary economic environment. Those councils locked into continuous and high levels of capital expenditure (mainly interface councils) cannot delay capital expenditure and must accept market prices 30% or more above estimates in their long-term financial plan.
If councils were run by nonnas, I reckon we would be starting to get creative and invent the local government equivalent of la cucina povera.
State of Victorian Local Government Finances, October 2022 by Municipal Association of Victoria and Local Government Finance Professionals

Pingback: 239 – Zombie councils | Local Government Utopia