880 words (10 minutes reading time) by Lancing Farrell
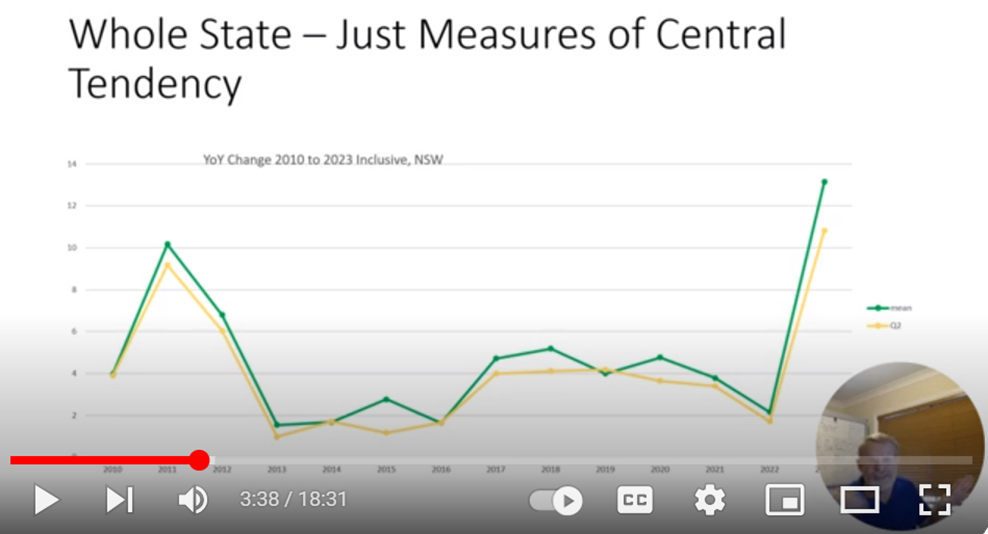
The mean and median of the data set for all NSW councils
Professor Joseph Drew has posted another enlightening video on his YouTube channel. His analysis of 15 years of council data in NSW shows worrying increases in expenditure on staff, materials and depreciation. In fact, ‘worrying’ is an understatement. The situation is becoming catastrophic. Yet, no one seems overly worried in the Premier State.
Professor Drew has committed to producing the same data for Victoria. Maybe there will be more of a response from the Garden State. As every gardener knows, you have to observe what is happening and make timely interventions for a garden to succeed.
One of the challenges Professor Drew’s video has highlighted for me is the relatively low level of executive financial literacy and knowledge of statistics and data. This might explain the lack of response to the data from local government. Professor Drew goes to great lengths to explain the importance of measures of central tendency and the difference between the available measures. In particular, he is looking at the mean and standard deviations of the data set, and the median .
Are you digging out an old text book or searching on Google yet?
To save you the trouble, measures of central tendency are useful when they can be relied on to describe what can be considered normal for the entire data set. The mean is essentially the average (sum of all values divided by the number of values), the median is the value with 50% of the data set is above or below it, and standard deviations indicate the spread of the data set. The mean is the preferred measure for normally distributed data, while the median is preferred when data is skewed.
As Professor Drew explained to me, knowing that the average age of a population is 48 is useful if most people in that population are close to 48 (for example, aged 45 to 55). If most are aged 100 or 1, it isn’t. This is a practical reason for why knowledge of standard deviations matters.

Comparison of rural and urban councils in NSW
Professor Drew shows the variation between urban and rural councils and the upper and lower quartiles of the data set, using the mean, median and standard deviations. NSW is in trouble. The mean increase in expenditure on staff is 6.03% with a standard deviation of 11.91, and the median is 6.48% . In this case the alignment of mean and median suggests the mean (or average), which most people use to understand a whole data set, is reliable.
When you separate urban and rural data, a different story emerges. Rural councils have controlled labour costs and only experienced mean staff cost increases of 5.74% with a standard deviation of 7.65, and median increase of 5.24%. In comparison, urban councils experienced mean staff increases of 6.25% with a standard deviation of 8.66, and median increase of 8.66%. Urban councils, where most staff are employed, have experienced much higher rates of wages growth. Well above the approved rate cap/peg in 2022-23, which was set for each council at between 0.7% and 5.0%. Wages typically comprise 50 to 65% of council operating costs.
This is of course worrying. Now for the catastrophic data.
The mean increase in materials costs in NSW (excluding capital) was 23.53% with a standard deviation of 30.35, and a median increase of 17.25% . Remember, a large number for the standard deviation means a wide range of data. Again, the split between rural and urban is insightful. Urban councils experienced a mean increase in materials expenditure of 15.08% with a standard deviation of 21.54, and a median increase of 12.99%. Rural councils experienced a mean increase of 35.05% and standard deviation of 36.5, with a median increase of 28.26%. Councils in the country are paying much more for materials than the city councils. Again, remember the rate cap was set at between 0.7% and 5.0%. Materials typically comprise 20 to 30% of council operating costs.
The figures on depreciation show a statewide increase in mean expenditure of 7.76% with a standard deviation of 16.36, and a median increase of 8.14%. Again, there is difference between rural and urban councils but it is not as consequential. It is likely that councils are ‘gaming’ depreciation as a non-cash expenditure to balance their books. It isn’t good that it exceeds the rate cap and implicit debt (i.e. the amount councils will actually need to renew or replace assets that must be funded by future generations) is growing when depreciation figures are fudged.
So, what does this all mean and what should councils be doing?
These are good questions and council executives I have quizzed about Professor Drew’s analysis can’t answer them. In my simple view, what it means is that if councils were private companies (as they purport to be copying in their management practices), they are quickly going broke. Expenditure exceeds revenue, and they are racking up explicit (on the balance sheet) and implicit (off balance sheet -i.e. assets not renewed) debt that future generations will have to pay. They are effectively trading when insolvent.
As to what councils should be doing, that will be discussed in s future post.
