Posted by Colin Weatherby 1300 words

The first post on improving service operations covered service action planning. Both posts have followed a discussion about service improvement with a colleague in which he described a process he has been using with operational staff to work out how their work can be improved. This post discusses redesigning services when that has been an action identified in the service action plan.
If the need to redesign services has been identified in the service action plan there is a good chance that all team members are on board and prepared to discuss some big changes. This is really a prerequisite for significant change in local government, otherwise there is a risk that you are just ‘revolutionising’ people and will have no long term effect.
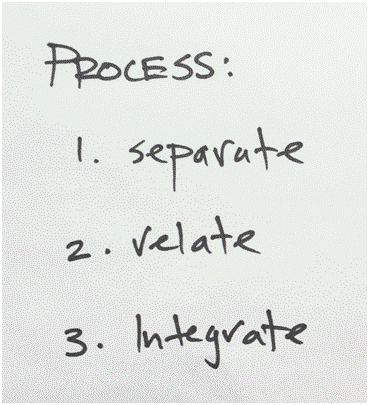
Stage 2 – Service redesign.
The first step is to separate the services with different demands, operations typology and performance objectives (this has been the subject of an earlier post). Then related services are grouped together. The last step is to redesign services to integrate similar services and plan implementation of the new service. This includes risk analysis of key aspects of the service and planning the new supervisory role required to make the service design work.
The following ideas are written on the whiteboard at the start of each redesign session. It is important to stick to the process to avoid circuitous discussions.
 The operations typology will need to be explained (it has been the subject of a previous post). Most people understand it immediately but few have heard about it or used it in their work. It helps to understand the volume, variety, variation and intensity of customer contact characteristics of the different types of demand for each service. The demand characteristics enabling the most efficient and lowest cost operations configuration is ticked in the diagram. The demand characteristics requiring the most responsive and highest cost operations are indicated by dots. There will need to be some discussion about the demands that are a hybrid of the two types of demand.
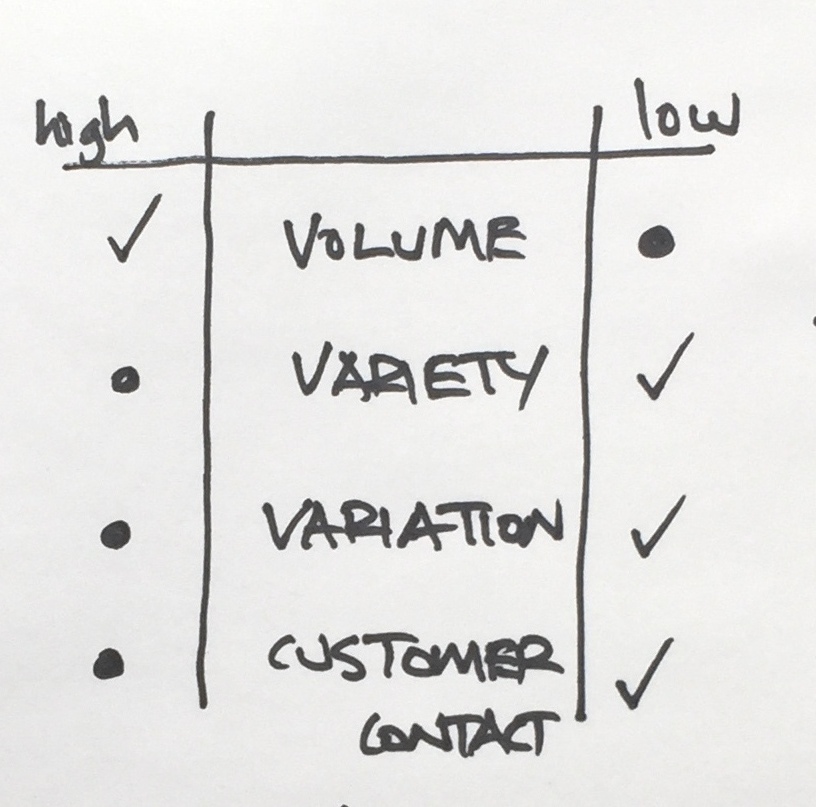
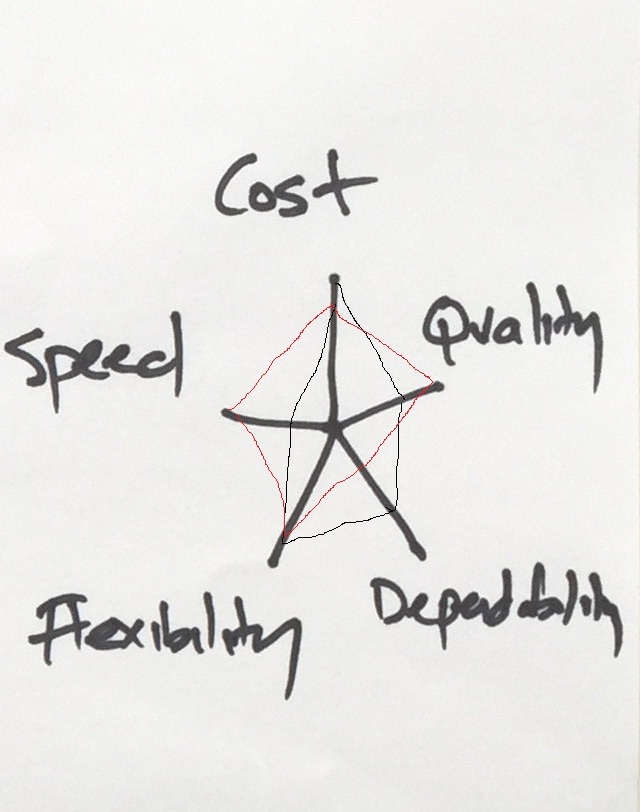
Then the performance objectives of cost, quality, dependability, flexibility and speed are then determined for each service. Again, these are likely to need explanation. Using a polar vector diagram, as shown, allows examples to be illustrated from current services. The intention is to show the comparative importance of each objective by drawing lines from each arm of the diagram to make a ‘kite’ shape, with lines starting furthest from the origin for more important objectives and closer for less importance.
 In practice, listing all demands/services is straightforward. Distinguishing between them on the basis of their operations typology or primary and secondary performance objectives can be more difficult. There is a risk that the ‘separation’ action can become too complex and difficult. To simplify the process a continuum was created that allowed services to be placed on it relative to each other.
In this case, the continuum went from services with lower risks in delivery, lower costs and ‘looser’ timeframes (i.e. more efficient, less responsive), to those with higher risk, higher costs and ‘tighter’ timeframes(i.e. less efficient, more responsive). Different continuums would be needed for groups of services with different characteristics. This worked for the services being looked at in this case.
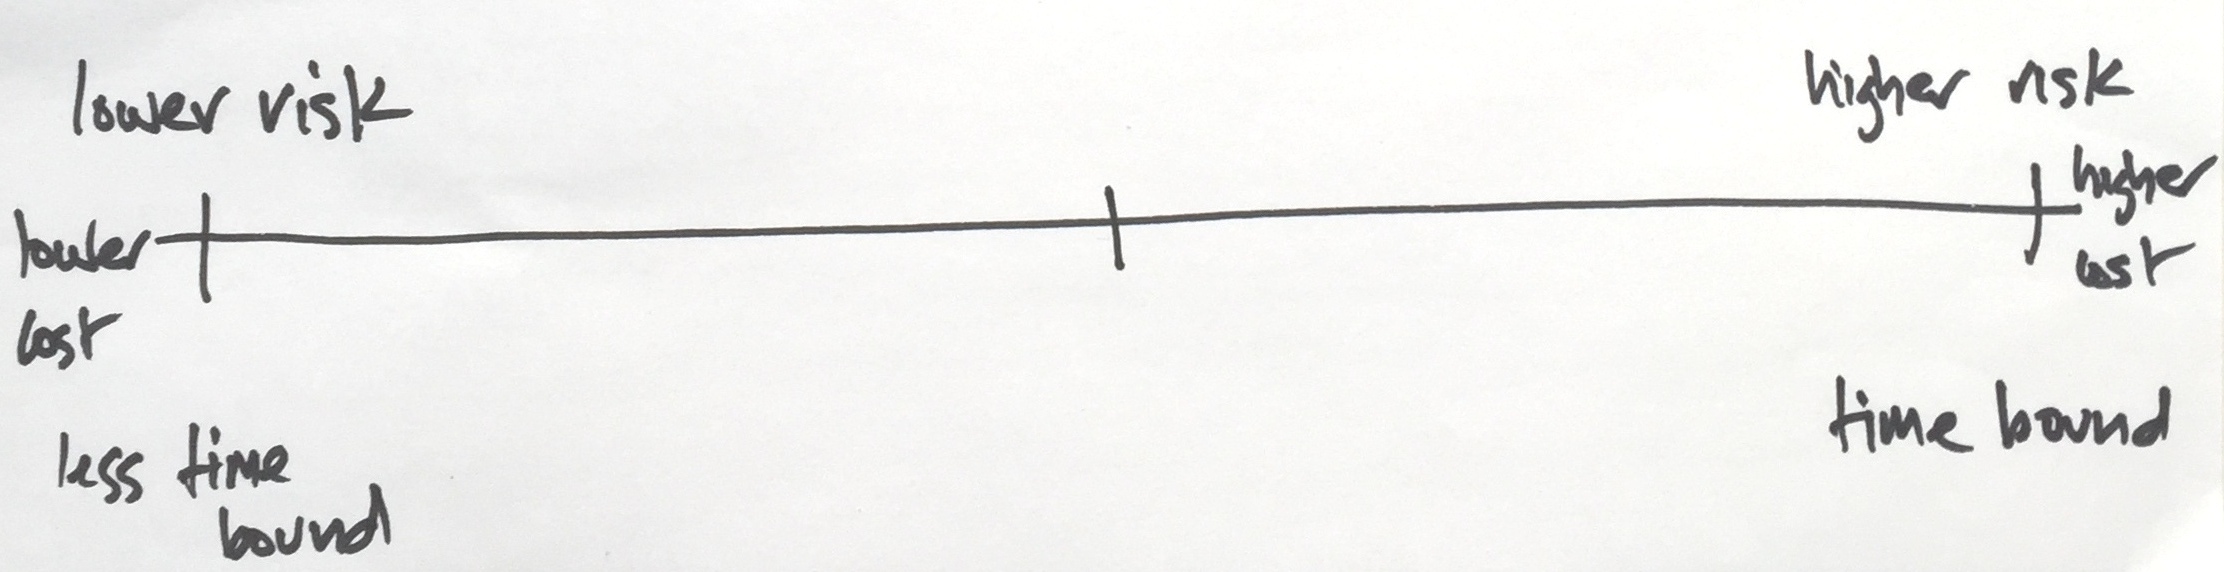
This approach converted a lot of complex data into a simple idea that everyone involved could understand. It allowed the Team Leaders planning the service redesign to locate services on the continuum and effectively separate them.
Once services had been placed on the continuum, data about workloads (quantity of demand) was assigned to each service to determine the required delivery capacity. This was then compared to the available capacity. It quickly became evident that if all of the work to be done was known in advance and it could be efficiently organized, that significantly fewer resources would be required.
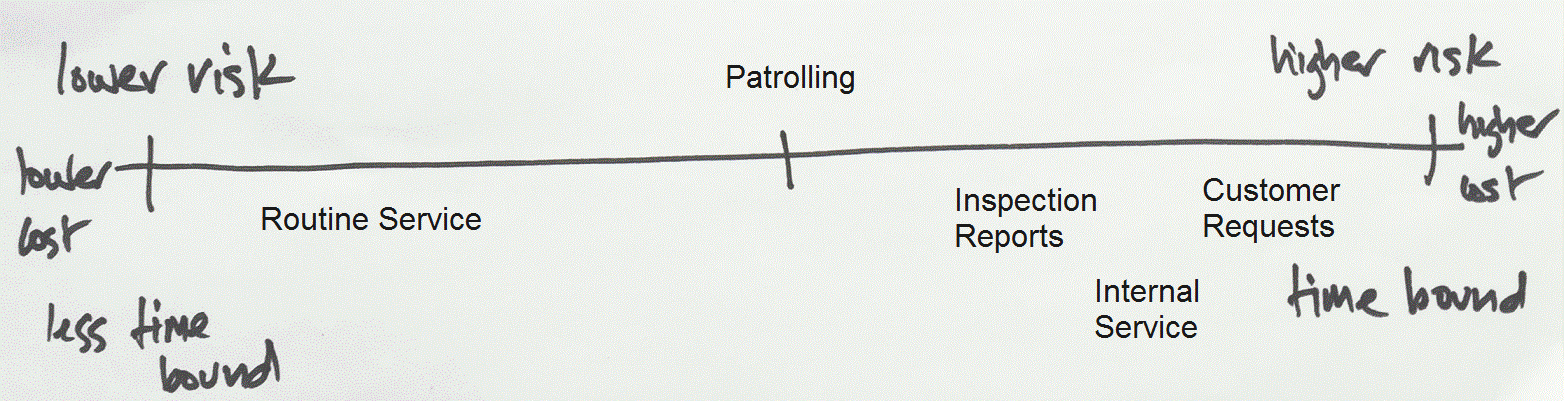
The challenge in this particular service area is to know about work in advance. A significant amount of work is generated by internal service requests (unpredictable but able to be scheduled) customer requests (unpredictable demand) and inspections (less unpredictable because inspections can be scheduled). The difference between dependent (more predictable) and independent (less predictable) demand will need to be explained, and finding ways to understand or limit the range of unpredictability could be important.
The remaining routine service was much less time bounded and inherently lower risk to deliver, and delivery failure was readily detectable and able to be remedied. It is able to provide a ‘buffer’ of staff time to support more time bounded services.
One discovery during the process was the amount of time spent ‘patrolling’. This is a time honored activity in council operational workforces in which teams drive around defined areas looking for work. In essence, two or more people are doing work that could be done by one person, and the inspections are uncontrolled and unrecorded.
It has persisted because teams tend to patrol on inclement days or when they have small amounts of time left at the end of the day or when they have done a hard mornings work or they don’t feel like setting up to do difficult work. It is the biggest cause of conflict between team members and source of allegations about malingering. It also provides supervisors with a buffer because staff find their own work instead of the supervisor organising it for them.
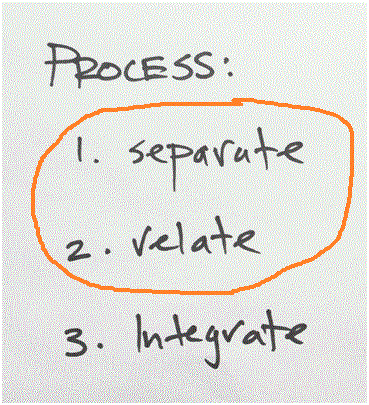 The ‘relating’ step was really dealt with in the ‘separating’ stage. When separated, the services that were different naturally fell into groups that had similar characteristics.
The ‘integrating’ stage required some effort. This is where designing the process to identify and set up work before feeding it smoothly into scheduled programs for teams became critical. It required an entirely new role within the team. The remaining work was separated into highly responsive work, batched and planned work, and buffer work. In all, the six available staff and their immediate supervisor needed to be organized into four work teams.
A peer review and risk analysis (by a fellow manager) showed that carrying out the inspections properly and ensuring that they are done is the biggest risk. Poor quality inspection reports or failure to carry out inspections would impact directly on the team waiting for the work.
The second greatest risk is that the team doing the work arising from customer requests and inspections could be overloaded (it was lesser risk that they might have insufficient work). This could be managed by planning the inspections and ensuring that the crew is always at full strength by drawing on staff from the buffer team.
The third highest risk is that the highly response internal service would be oversubscribed. This risk could be more easily controlled by managing the demand and accessing external service providers in peak times.
The final risk was that the buffer work that is lower risk and less time bound would simply not be done. This could be controlled by periodically assessing the amount of work completed and scheduling ‘catch up’ services by suspending other work programs and redeploying the other teams for a short period or providing overtime or using external service providers. There would be time to decide and organize.
The roll out of the new work design will involve replicating the process to do the redesign, this time including all team members, not just the supervisory group. The underlying theory, the actual workload data, the capacity required and the risks will be discussed and debated.
The intention is to get everyone involved over a period of four weeks to understand what is driving the redesign, what the benefits will be for everyone (the community, the team members, the organisation) and resolve finer details of the design regarding who will take different roles, whether or not team members will rotate through all roles, etc.
I will keep you informed.
